Sunday, November 29, 2009

Winter: downside of a radiant barrier?

One thought that has been on my mind lately, with our cold weather fast approaching, is whether the radiant barrier will make it harder to heat my house throughout the winter. One nice thing about living in central Texas has been that, even on the coldest winter days, the sun has enough power to warm the house pretty significantly by afternoon if the day is sunny.
But the radiant barrier rather effectively rejects that radiant energy. This, of course, is a bad thing during the winter, but a really great thing during the summer. The balancing factor during the winter is the fact that a lot of heat that would typically radiate out of the warm attic during the night will be reflected by the barrier back down into the house, keeping the house from cooling as quickly during the night as it otherwise would.
So some questions arise:
  1. Does the radiant barrier help me or hurt me overall during the winter months?
  2. If it hurts me, does it cost me more energy during the winter months than it saves me during the summer months?
  3. How can I find out the answers to questions 1 and 2?
As it turns out, my home is heated by natural gas, and the company was willing to provide my natural gas usage since 2005. So I will be able to perform some analysis.
Just as there is Cooling Degree Day data out there on the web, there is Heating Degree Day data as well.
When this winter is over, I plan to perform a natural gas usage vs. Heating Degree Day analysis, similar to the kWh usage vs. Cooling Degree Day analysis I performed for the cooling system of the house. The graphs generated from that data should help answer questions 1 and 2.
As usual, there will be complicating factors. First, when I finally completed the radiant barrier this spring, I blew in a bunch of extra insulation. That will certainly affect my results, but I don't have a very good way to account for it. Second, there are really only about 3 months of significant natural gas usage in the house: December, January, and February. That is not very many monthly data points when compared to the 5-6 months of significant cooling usage in the summer, meaning that it may be harder to identify trends. Finally, my cooling energy is measured in kWh, but my heating energy (burning natural gas) is measured in "ccf" which is 100 cubic feet, a volume of natural gas (presumably at atmospheric pressure), so we'll need a conversion factor between the two which may carry its own complications.
Despite these difficulties, we should be able to determine in general whether my cooling-focused improvements have helped or hurt my house's heating-related performance.
Stay tuned until after the gas meter is read in February to find out!

Tuesday, November 17, 2009

Trees and Geezers

Let's take a quick moment here to point out a basic point about this blog so far. Despite technical discussions about heat transfer and complicated graphs with curves and lines on them, the actual things we're doing to the house are pretty simple. Other than replacing the broken air conditioner, every significant improvement I've made to the house is "geezer tech": something that your grandfather could well have done 50 years ago. This includes things like sealing up ducts, considering attic airflow for cooling, and for the imaginative granddads, perhaps even putting up reflective material to bounce the sun's heat back out. (My own father actually did this many years ago with part of his house, using kitchen aluminum foil ... it must run in the family).

The other thing to point out is that there are other ways of achieving energy savings than actually doing something to your house. One significant factor which I haven't really captured is the effect of the slowly growing shade trees around my house. We started in this house with tiny oaks on the west side of the house, but they had no effect until about 5 years in, when they had grown enough to provide shade over the west-facing kitchen windows in the hot afternoons. The kitchen cooled dramatically that year (this was before 2005, when I started taking data; I shudder to think what _those_ graphs would have looked like). There must have indeed been some good energy savings; shade trees are Nature's radiant barrier.

Another way to save energy, if you're designing or planning your own house, is to use passive solar design, something that was done rather poorly with the layout of my house. Since the sun travels further north (in this hemisphere anyway) in the summer, and further south in the winter, you can put your maximum window area facing south, where the incoming solar energy helps you the most in winter, and hurts you the least in summer. Of course, in my "energy efficient" home, the north-facing wall has 5 times the window area of the south-facing wall, meaning that I've got the exact opposite of what I should for this area. In addition, as it turns out, the positioning of my eastern neighbor's trees gives me great shade in the winter, when I don't want it, and only partial shade in the summer, when I could really use it.
I am still considering planting another tree that would give my east-facing back porch some nice shade in the summer, but who's shadow would miss the house in the winter; a sort of passive solar tree design. Unfortunately, that same tree will likely shade some of my northern neighbor's south-facing windows during the winter, so I need to be careful with the placement.

Anyway, the point of this little post is to remind folks that this isn't rocket science, it's really not all that technical in terms of the actions we're taking, and it's really not all that difficult. A 50% reduction in energy usage doing things that your grandfather probably knew how to do really seems like, well, a no-brainer. Energy efficiency waits for no man! What are you waiting for?

Monday, November 9, 2009

The mysterious number 2.6

When performing the accumulated Cooling Degree Days analysis, which the mindful reader will recall incorporated the memory (a.k.a. hysteresis) of the system to try to get a better handle on the effectiveness of the improvements, we ran across an interesting, nay fascinating result.
It turned out that a pretty good linear model for the response of energy usage to varying cooling degree days (CDD's) took into account the temperature of the previous month as well as the temperature of the current month. The fascinating part of this was that, when determining how much energy my house was going to use, the temperature of the previous month mattered 2.6 times more than the current outside temperature.
This flies in the face of everything that I had learned about homes and insulation theory, at least before I started down the path of Energy Efficiency enlightenment. How is that? Well, like many of you out there, I had learned that the way to keep your buildings cool was to keep that hot air out, and keep a good thermal wall between the cool inside air and the hot outside air, in the form of things like double-pane windows, thick walls, and thick insulation. This would slow the flow of heat from the hot outside air into the interior airspace. And to be sure, my house is now well sealed and has decent windows. However, if that were the 100% correct approach, then why does my real world data show that some factor other than the current outside air temperature matters more? In other words, if the problem is really hot outside air, why doesn't the current outside air temperature dominate the model? If the traditional insulation theory is valid in my case, why does the temperature of air from last month that's not even around any more account for some 72% of the correlation, while the supposed main problem, hot air currently surrounding the house, accounts for only 28%?

Something is definitely amiss with our theory.

Ruminating on this problem leads us to an inescapable conclusion: in my area, during my cooling season, the main heat transfer mechanism into my house must not be direct convection from hot outside air. The traditional "double-pane window, lots of insulation" approach which attacks the convection problem is quite literally missing 72% of the target.
So how is most of the heat entering my house? Well, we have exactly one clue to help us find the culprit. Since we've seen that greatest determinant of the energy usage in June, for example, is the temperature in May, it must have to do with the heat being stored over time in someplace other than the outside air. Possible culprits:
  1. Heat stored in the ground -- During the course of the typical dry summer here in central Texas, the ground becomes parched and unable to cool itself through the mechanism of evaporation, since there is no water to evaporate. Much of the vegetation also goes dormant to survive, not performing its usual transpiration which might also effect some cooling. The ground is in thermal contact with my house's foundation, and heat could certainly conduct into the concrete foundation, and once there, into the interior airspace via conduction or radiation.
  2. Heat stored in all the thermal masses around my house -- Neighboring houses (all of which have nice heat-storing brick sides), sidewalks, and streets all store heat during the day, and radiate so much of it that it is noticeable even to the casual observer walking by after sunset. That radiated energy will be coming into my house from low angles and thus will unfortunately avoid my under-the-rafters radiant barrier.
  3. Heat stored in the thermal mass of my own house -- The bricks on the outside walls certainly store a lot of heat, and that heat can conduct or radiate into the interior of the house. The attic itself consists of a lot of wood and some metal as well as insulation, all of which can and do heat up and store that heat over time, again conducting or radiating to become a problem.
As far as which of these is the most significant, it is difficult to say. I have not seen any indication from other web sources that heat conduction from the ground into the slab is a big problem; it may well be that down at the bottom of my slab, several feet underground, the ground is not particularly hot. (Some data on soil temperature variation with depth in my area would be nice, if anyone can point me to it). However, all that concrete would certainly store a LOT of heat. Unfortunately, now that the house is built, I don't have any good way to insulate between the foundation and the ground, or between the foundation and the interior space. I have heard of foundation insulation during construction, but all the examples I have seen so far are in much colder climates, attempting to reduce heat flow out of the house rather than into it. Furthermore, I have no low-energy means to cool the foundation itself.
To address #2 and #3, having a radiant barrier in all the walls and windows would go a long ways towards reducing the heat gain there. Even my own bricks could be separated via a radiant barrier from the interior space, keeping their significant heat gain from being a problem on the inside of the house. I would be interested to learn how much heat gain is radiating in through my windows, and how much through the walls. There are "low-e" (emissivity) coatings that can be added to existing windows, and I suspect those could be a significant help to me.
Unfortunately for #3 (the heat stored in the thermal mass of my own house) since my house is already built, it would be prohibitively difficult and expensive to rip open the walls and install foil barrier there.
So with this analysis we have identified 3 possible culprits for the main predictor of the heat load coming into the house, and only one of them can be partially addressed as a retrofit project: the radiation of heat in through my windows from nearby sources. The others needed to be addressed in construction, and it is now too late for that.
Well, now that the attic is pretty well taken care of, our analysis of that mysterious 2.6 factor seems to be pointing us in the direction of windows. And so let us begin to follow this new trail; let us examine and look into the efficiency of windows, and how to improve it, soon...

Sunday, November 8, 2009

Summer 2009: Vaulted Ceilings Saga continues

So the weekend before the roofing crew was to show up, I needed to create roughly 16 pieces of 4'x8' decking, covered with radiant barrier foil and properly spaces baffles, to be ready for the job the following week.
As luck would have it, illness struck that weekend, but even in those early days, I knew that Energy Efficiency would wait for no man(!), and I toughed out the job of moving those rather awkward pieces of decking around and working on them. The job was made easier by the fact that the radiant barrier was already 4' wide, making it a matter of a single measure and cut operation to get the barrier on each piece. To cover 8' of length with baffles required 4 baffles per decking piece, but again, that was fairly simple and required mostly eyeballing with a little measuring.
Finally, it was the next week, and the crew arrived. I couldn't sit inside and just hope that the new decking was installed properly; I had to go out and see it. Although they wouldn't let me up on the roof, I was able to assist with a few things like cutting decking for odd-shaped areas near the corners of the roof, and creating 2 or 3 more pieces of radiant barrier decking since the original estimate had been a little low.
Preparing to staple baffles to a new piece of decking

The roofing crew was quite competent, and despite the July heat they completed the job in a single day. My hat is off to them for their professionalism in dealing with a job that had a few more components to it than usual. Here is a shot of one of the last pieces going on to the back roof. The baffles and radiant barrier are facing down, of course, but they are there. You might be able to tell that we had to go two 4' widths in from the outside wall to make certain we had enough length to cover the vaulted ceiling portions, as well as to get above the level of insulation in the attic so that the open end of the baffles inside the attic would be clear.

Later that night, it was clear that the new barrier had helped, although the change was not as dramatic as adding the initial barrier; after all, we were adding roughly 600 square feet to an already existing 1500 or so square feet. Significant, but not as much as going from 0 to 1500 square feet the first time.
This improvement yielded us the following benefits:
  1. 600 square feet of radiant barrier
  2. Far better barrier coverage over the master bedroom (from 70% to 100%)
  3. Significant improvements to the intake ventilation
  4. 600 square feet of new decking to replace worn (admittedly still functional) decking
The overall cost was around $700, $540 for the plywood decking and around $150 in materials (baffles and foil barrier) making the roughly $1.20/square foot cost of this improvement the most expensive per-square-foot change that I'd made. Again, I balked at doing it initially due to the cost, but I thought that I would regret it over the next 15? years until we got our next new roof if I didn't do it. The improved airflow and ventilation coverage seemed worth it.
The benefits from this job are already pretty well accounted for in the analysis of the 2009 energy data here since this change occurred in July of 2009. I am considering trying to examine 2009 May and June, before the change, with July-September, after the change, but that might not prove very conclusive given the short timescales.

In the meantime, the number 2.6 has been on my mind, and its significance might require some more discussion. Until next time!

Summer 2009: Finally addressing vaulted ceilings!

After a few posts on analysis, we are returning to the narrative of what changes I made to my inefficient house to achieve dramatic savings and comfort.
After the early spring completion of the radiant barrier and the subsequent installation of a good chunk of blow-in insulation, my attic efforts were largely complete. The only remaining concern nagging at me was the fact that around the border of roughly half of the house, I had vaulted ceilings that were inaccessible from the attic as well as from the outside. There was no way, short of removing roof shingles and decking and attacking from the top, to install radiant barrier in these areas.
This was somewhat unfortunate, because this was a good 4 feet of ceiling along the outside wall that I could not cover, extending around half the house. Furthermore, two runs of vaulted ceiling intersected over the master bedroom, making that room at best 70% coverable with radiant barrier, unless one were to do something dramatic like replace the roof.
Well! As it happened, a (rather convenient) massive, record-breaking hailstorm occurred in March. The damage from that particular storm damaged roofs in my area severely enough that crews are _still_ in our neighborhood replacing roofs, lo these 7 months later. In fact, they are all over this part of town. (And, in a development near and dear to all of our Energy Efficient hearts, a lot of the new roofs I see are getting ridge vents installed. I do not know if they have investigated clearing their soffit vents or not: perhaps some of them will read this blog and know what to do.)
So, although the insurance deductible payment was not trivial, this turned out to be the year to get a new roof. And of course, since this roof replacement event happens less than once a decade, I wanted to take the opportunity to try to make my changes to the decking over the vaulted ceiling areas.
From the beginning I learned that this was unlikely to be as cost-effective as the other improvements that I had made, mainly because I would be forced to replace existing material in the house rather than simply add to it as I had until this point. The material I had to replace was roof decking; there was no practical way to bring up the old decking without tearing it up. In effect, the extra cost I was paying was because I was giving up decking that probably had another 10 or 15 years of life on it.
The deal I reached with the roofer, who was quite helpful, was this: The new decking was going to cost me roughly $1/square foot. Since he couldn't find radiant barrier decking in the exact thickness to match my existing decking, he was going to supply me with the new decking the weekend before the job. Since I still had plenty of radiant barrier left over, I would construct homemade radiant barrier decking by stapling sheets of radiant barrier along one side of the 4' x 8' pieces of decking. Then the crew would remove the existing non-radiant-barrier decking from the parts of the house that I showed them, and replace it with the new homemade radiant barrier decking. The only cost to me would be the cost of the new decking, which I felt was more than fair.
Another helpful thing about replacing the roof decking is that it would help me resolve another problem that had dogged my attic from the beginning: lack of intake ventilation. As you may recall, I had unclogged all the soffit vents that I could reach from the attic. However, there were many places, all of them over vaulted ceiling, where the vents were still blocked due to the impossibility of getting my body in front of the area to work. Replacing the old decking gave me access from outside, allowing a chance to install baffles on the bottom of the new decking to create airflow where there had been none before.

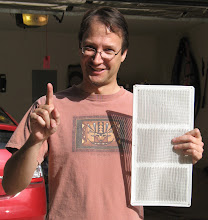
4'x8' decking with baffles and foil barrier

You can see from the picture above that the combination of radiant barrier and baffles works quite well! I had first stapled radiant barrier to each piece of decking (except the last couple of inches on either end, which were going to be nailed to rafters anyway), then stapled baffles over the top of these, spacing the baffles to where the parts flush to the decking would coincide with the rafters.
To review our radiant barrier theory, the radiant barrier needs an airspace adjoining it to work; having it touch insulation or anything else destroys its reflective properties (recommended is at least a 3/4" space; these baffles gave about 1"). The baffle serves to create that needed airspace. In addition, the airspace is creating a channel to allow outside airflow into the attic from the soffit vents, cooling the attic during the evening hours when the barrier isn't helping. Thus, these cheap Styrofoam baffles perform double duty, allowing the barrier to reflect heat out before it causes trouble, and cooling the heat that does get through by enhancing attic airflow. They are truly an excellent value to the discriminating Efficiency Enthusiast!
The only downside is apparent from the photo: each baffle has a couple of inches running down the edge and through the middle that touch the barrier. These are necessary to give you a place to staple the baffle as well as to provide structural support, but along these runs, the radiant barrier will not work due to lack of adjoining airspace. So for each of these pieces of decking with barrier and baffles, I am probably getting only about 80% of the reflective power of the barrier. Still quite worth doing. I even considered trying to install small strips of radiant barrier along the top of the problematic portions of the baffle, but that would have been a good bit of work for very little square footage of reflection, plus, depending on how much the insulation bent under the pressure of the baffle, these sections might have contacted insulation anyway after installation, making them nonreflective. So I left the decking as you see it in the photos.

Thursday, November 5, 2009

Take 2: Characterizing Hysteresis

In my last post, one of the caveats about my results in determining cooling effectiveness was that the real-world data shows hysteresis, or memory, which makes determining the effectiveness of cooling difficult if it the calculation is based only on the temperature outside.
I have attempted to take into account some of this memory by replotting the energy use (kWh) vs. Cooling Degree Days (CDD) data, but with the following change: the CDD numbers on the X axis are the sum of the current CDD value added to a factor times the previous month's CDD value. For for a given month on this plot,

Accumulated CDD = (Factor * previous CDD) + CDD for this month

I utilized the Standard Error function in Excel, STEYX(), to assist me in determining the value of "Factor" by trial and error. I chose a value for "Factor" that minimzed the total standard error of the function; i.e. the sum of the errors of Y as they can be predicted by X. In another intriguiging twist, this yielded a value of greater than 1; in fact, a value around 2.6 actually worked best.
What does this mean? This means that last month's weather matters a lot more (2.6 times more) than this month's weather in determining how much heat is going to entering my home. Another fascinating result, suggesting that once again, simple air convection or conduction (represented by this month's CDD) through the exterior of the house has a lot less to do with cooling load than radiation of the hot environment around me (represented by last month's CDD). Another argument for full-house radiant barriers, if anyone is listening! In fact, the low-emissivity ("low-e") coating on modern windows helps perform exactly that radiant barrier function, but on the sides of the house, somewhere that my attic-based radiant barrier doesn't cover, and something I hope to learn more about in the future. So far, replacing windows has been off of my list due to cost constraints (my entire radiant barrier cost a lot less than 1 window), but there are efficiencies to be gained there as well. But I digress...
I actually also tried this model with a second factor multiplied by the CDD from 2 months ago, but trial and error yielded almost no impact: the factor was less than 0.1. This indicates that the main factors are (in order of importance) last month's temperature, then this month's temperature.


You'll notice a few things right off the bat:
  1. The "best fit" lines look a little high. The reason: I made them fit starting at 500 accumulated CDD; I considered everything to the left of that as noise. So the slopes should match the hottest (right hand) part of the curve well, even if their level looks high. The slope is what I'm after; we're going to ignore the intercept (height) of the lines.
  2. If you compare to the previous 2005 graph, you'll see that the effect of using accumulated CDDs has been to turn the large loop of 2005 data into a double loop, with a crossing in the middle. Intuitively that makes sense: that minimizes the error between a line drawn through the middle of the loop and the loop itself. The standard error for the raw 2005 CDD data was 564; the standard error for accumulated CDD data is 473, a significant improvement, meaning that a line fits this data better (although clearly still not great!)
  3. If you compare to the previous 2009 graph, you'll see that the effect of using accumulated CDDs has been to turn the small loop of 2009 data into almost an exact line. The fact that it's a nice fit for the line means that the house's response to temperature has become much more linear; the "loopy" nonlinear part only appears far to the right in the hottest areas. The standard error for the raw CDD data for 2009 was 141; for the accumulated data, it drops to 95. Looking at the graph, you can see that the best-fit line matches quite well.
So now that we've got a better model, particularly for the 2009 data, how do the slopes compare? We've got a slope of:
2005: 0.99 kWh / accumulated CDD
2009: 0.27 kWh / accumulated CDD

Taking reciprocals to convert to effectiveness:
2005: 1.01 accumulated CDD cooled per kWh spent
2009: 3.73 accumulated CDD cooled per kWh spent
Effectiveness ratio: 3.7 to 1
Conclusion: when taking the hysteresis of the system into account, our home improvements look even better. Rather than a 70% improvement in effectiveness based on the immediate CDD method, I may well be looking at a 73% improvement based on a more accurate model.
While not a massive change, this analysis makes me feel a bit better in that I've now accounted for the rather obvious hysteresis in the data, and come out with pretty similar numbers.
There remains the lingering question of the nonlinearity all through the 2005 data and at the very far right of the 2009 data. It would appear that when things get hotter than the house can handle (which seems to happen immediately in 2005, but not until about x=2000 accumulated CDDs in 2009), energy use gets bumped up nonlinearly. There are probably good physics reasons for this nonlinearity, but I will leave it to my readers to write in a let me know what they might be and how I might model them - or even better, prevent them!
In the meantime, this diversion into analysis was fun, but we still have a little bit more story to tell about the home energy efficiency projects completed in 2009. Stay tuned!

Wednesday, November 4, 2009

Cooling effectiveness: check!

I will repeat from my last post:

The energy cost of cooling my home 1 degree has dropped 70% due to my efforts.


Energy efficiency enthusiasts, be enthusiastic! This is an incredible number. Every kWh of energy I run through the air conditioner cools me 3.4 times more effectively than it did in 2005 when I embarked on this journey. And, in a big Energy Efficiency Man plus, almost none of the improvements that brought me these savings will break, wear out, or require maintenance. Ridge vent? No moving parts. Baffles and soffit ventilation improvements? No moving parts. Additional insulation? Will last the lifetime of the building barring roof leaks. Radiant barrier? It's foil hanging from the rafters, folks. The business end is the reflective side facing down, and it won't even get dusty after decades up there.
Yes, the more efficient A/C unit will wear out, but I have little choice but to have an A/C unit of some type here. It is definitely the weak link, and will undoubtedly give me trouble, but it's awfully nice to have when it's 100 degrees in September.

Caveats:
  1. This estimate is based on a linear analysis with a simple "slope-intercept" fit. A better analysis would take the hysteresis of the system into account.
  2. Your mileage may vary: these improvements work quite well in my 5-month cooling season-dominated climate. Effectiveness of all improvements depend on your climate and house situation.
The above notwithstanding, the data (and energy bills!) clearly show much less dependence of the house on the outside temperature as was true only 4 years ago. Truly, the house is cooler to live in as well as easier to cool through most of the year.